
Having recently enabled HTTP/2 support on my blog, I was curious to see just how many of my visitors would be using the new protocol. I'm going to demonstrate how you can easily track the exact usage of HTTP/2 and other features of your web server. This includes whether visitors are using HTTP/2 or HTTP/1.x, which version of TLS is the most common and which cipher suites are most prevalent, to name a few.
Introduction
I'm using NginX on Ubuntu and we're going to be looking at how to enable custom logs to track the usage of which HTTP protocol versions, the TLS protocol versions and the particular cipher suites used. With some simple configuration changes to log the information we need and some simple commands to parse the data, you can glean some incredibly useful data with very little work.
Create a custom log format
To instruct NginX to log the data that we need, we have to define a new log format. This has to be done in the http context of your NginX configuration, so in the /etc/nginx/nginx.conf file.
http {
    log_format scott_custom '$ssl_protocol $ssl_cipher $request';
This declares a new log_format, that I've called scott_custom. You can change the name of the new format if you like. Following that is the actual format that we want the log file to take. The $ssl_protocol and $ssl_cipher variables are fairly self explanatory and the $request variable contains the HTTP method used, like GET or POST, the path of the resource requested and importantly, the version of the HTTP protocol used like HTTP/1.1 or HTTP/2. Once you have created the custom log format save the file and we need to move on to instructing NginX to use this new log format.
Enable custom logging
To tell NginX to use the new log format we've created, you need to do so in the server context, so we're moving over to our virtual host file /etc/nginx/sites-available/default. Inside your server block you need to declare a new access_log and use our custom log format.
server {
    access_log /var/log/nginx/scott_custom.log scott_custom;
Here we're creating a new access_log that will write data to /var/log/nginx/scott_custom.log using the custom log format scott_custom. Save this file and exit, we're all set. Before you push the new configuration live, you can have NginX test it to make sure everything is valid.
sudo nginx -t
If everything checks out you should get a success message like this.
nginx: the configuration file /etc/nginx/nginx.conf syntax is ok
nginx: configuration file /etc/nginx/nginx.conf test is successful
Now the configuration is ready and it all checks out you can enable it by restarting the NginX service.
sudo service nginx restart
 * Restarting nginx nginx [ OK ]
Viewing your new log
Now that everything is up and running you should be able to see your new log data. Tail the log file to see a live view of each and every connection made to your site.
sudo tail -f /var/log/nginx/scott_custom.log
While you're tailing the log file navigate around your site and you will see each connection create a new log entry.
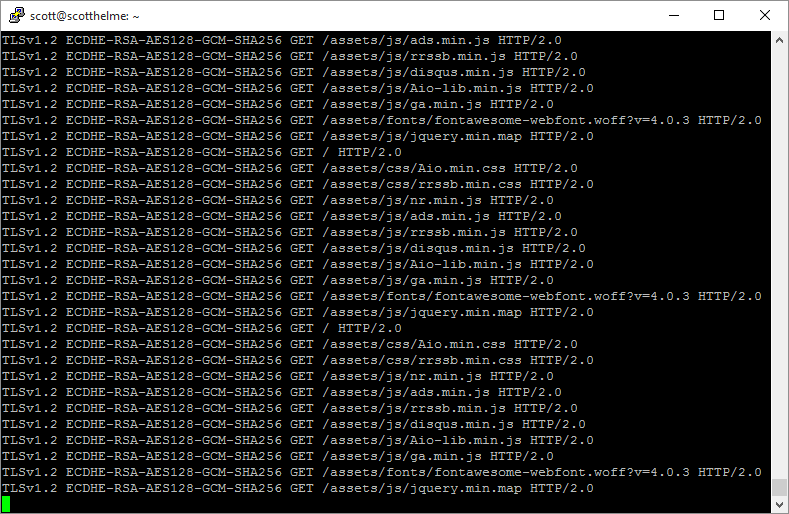
As we defined in the custom log format, you can see the version of the TLS protocol used, the cipher suite used and the request that was made which includes the method, GET in this case, the path of the resource and the version of the HTTP protocol used. This is all good and well, and exactly the information we need, but we need to parse it properly to make use of it.
Parsing the log file
Linux has a really handy utility called awk that's designed to manipulate textual data which is great for log files. We're going to use it, coupled with a few other utilities, to very quickly and easily parse our new log file.
awk '{print $1}' /var/log/nginx/scott_custom.log | sort | uniq -c | sort -rn
Run the above command and you will get the following output.
8793 TLSv1.2
 907 TLSv1
  23 TLSv1.1
That's it and it really is that simple! Let's break that command down and look at how we can change it to provide information on the other variables we're interested in. When you feed a line of text in to awk, by default, it will split the line on the space character and each element becomes addressable using $1, $2 etc... Looking at one of our log lines that would give us the following.
($1)TLSv1.2 ($2)ECDHE-RSA-AES256-GCM-SHA384 ($3)GET ($4)/ ($5)HTTP/2.0
Or to put it more nicely.
- $1 - TLS protocol version
- $2 - cipher suite
- $3 - HTTP method
- $4 - path
- $5 - HTTP protocol version
So, to get started, we're telling awk that we only want to print out the first variable after we've split the line, which is the TLS protocol version in this case.
awk '{print $1}'
The next part is just the path to the log file that we want to feed into awk line by line.
/var/log/nginx/scott_custom.log
All of this is then piped (|) to, or simply passed to, another command, sort.
| sort
Sort will simply arrange all of the lines of text, which now contain just the TLS protocol version, so that all of the versions are grouped together.
Before      After
TLSv1       TLSv1
TLSv1.1     TLSv1
TLSv1       TLSv1.1
TLSv1.2     TLSv1.1
TLSv1.1     TLSv1.2
TLSv1.2     TLSv1.2
TLSv1.2     TLSv1.2
This output is again piped into another command, uniq, with the -c flag set. Uniq simply grabs all of the unique lines in a text file and removes all duplicates. The -c flag tells it to prefix the remaining lines with the total (c) count of occurences of that line.
| uniq -c
Looking at our example above, this would leave us with the following.
2 TLSv1
2 TLSv1.1
3 TLSv1.2
One last step and we pipe the output again into another command, sort -rn. Whilst we're using sort again, this time the -rn flags tell sort to sort the lines by (n) numerical value and in (r) reverse order.
| sort -rn
This would give us our final output of.
3 TLSv1.2
2 TLSv1.1
2 TLSv1
To modify this command to give us further information all we need to do is change the index to the item we want to output information on. Referring to the earlier list, and the point of this blog post, if I want to see how many connections are using HTTP/2 I simply change $1 to $5.
awk '{print $5}' /var/log/nginx/scott_custom.log | sort | uniq -c | sort -rn
If I run that against my current log file that's been active for the time I've been writing this post, I get the following output.
6976 HTTP/2.0
3748 HTTP/1.1
  31 HTTP/1.0
You can then simply step through each index to output the information for each variable in the log file.
awk '{print $4}' /var/log/nginx/scott_custom.log | sort | uniq -c | sort -rn

671 /rss/
303 /assets/css/Aio.min.css
301 /assets/css/rrssb.min.css
290 /assets/js/ga.min.js
284 /assets/js/nr.min.js (trimmed here for sanity)
awk '{print $3}' /var/log/nginx/scott_custom.log | sort | uniq -c | sort -rn

10108 GET
  466 PUT
  160 POST
   89 HEAD
    1 OPTIONS
awk '{print $2}' /var/log/nginx/scott_custom.log | sort | uniq -c | sort -rn

7231 ECDHE-RSA-AES128-GCM-SHA256
1749 ECDHE-RSA-AES256-GCM-SHA384
 920 ECDHE-RSA-AES256-SHA
 405 DHE-RSA-AES256-GCM-SHA384
 351 ECDHE-RSA-AES256-SHA384
  76 DHE-RSA-AES256-SHA
  68 AES256-SHA
  15 DES-CBC3-SHA
  14 ECDHE-RSA-AES128-SHA
   1 DHE-RSA-AES256-SHA256
The Results
After running the new log format for a few weeks I've scooped up the data and using the above commands I've gathered the following data.
HTTP Protocol Usage
The HTTP/2 protocol is already used for the majority of the traffic to my blog! In the period I've been using my custom log there have been 206,914 requests processed. Here's the breakdown of HTTP protocols for those requests.
HTTP/2 - 122,664
HTTP/1.1 - 83,073
HTTP/1.0 - 1,177
Or, to make that look a little prettier and easier to grasp.
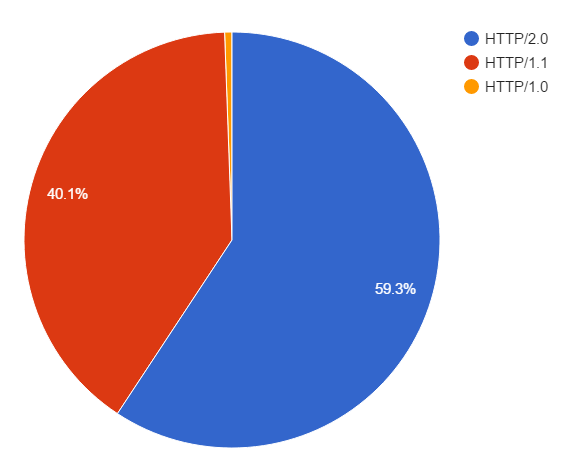
As I said, the majority of my traffic is already using HTTP/2 at 59.3%! The remainder is using HTTP/1.1 and there are probably a few bots or crawlers somewhere still using HTTP/1.0 to communicate.
TLS Protocol Usage
Not strictly on topic for a blog on HTTP/2 but these are interesting metrics that I'd like to share.
TLSv1.2 - 189,246
TLSv1 - 16,131
TLSv1.1 - 1,546
A much larger portion of the traffic than I expected is using TLSv1.2, which is a good thing, but I expected TLSv1.1 to be more widely used than TLSv1.0, but that's not the case.
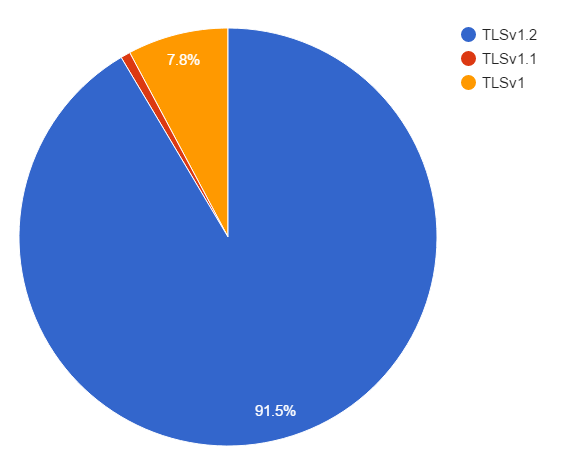
As you can see, a staggering 91.5% of my traffic uses TLSv1.2, and almost all of the remainder drops right back to TLSv1. Anyone thinking of dropping support for TLSv1 and supporting the newer TLSv1.1 and TLSv1.2 might be surprised to learn that dropping TLSv1 could have a bigger impact on traffic than dropping TLSv1.1 instead.
Cipher Suite Usage
Again, slightly off topic for this blog but I wanted to publish the numbers for my cipher suite usage too.
ECDHE-RSA-AES128-GCM-SHA256 - 124,630
ECDHE-RSA-AES256-GCM-SHA384 - 47,806
ECDHE-RSA-AES256-SHA - 15,349
DHE-RSA-AES256-GCM-SHA384 - 7,735
ECDHE-RSA-AES256-SHA384 - 7,324
DHE-RSA-AES256-SHA - 2,283
AES256-SHA - 931
ECDHE-RSA-AES128-SHA - 410
Others - 455
I'm quite pleased with the results!
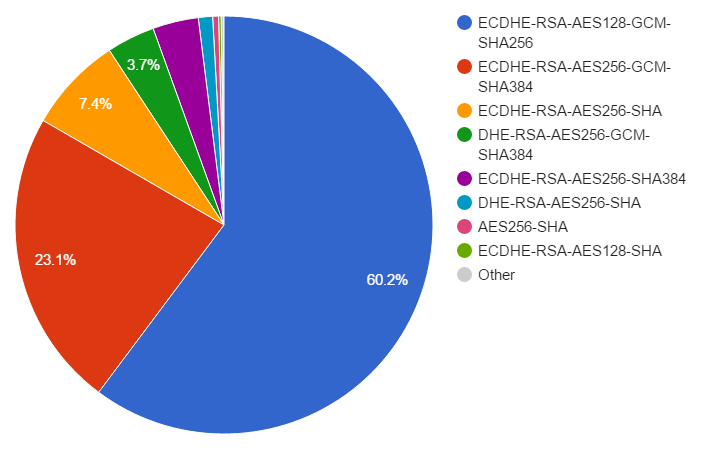
As with the protocol usage, a large majority of my traffic is using a single cipher suite, ECDHE-RSA-AES128-GCM-SHA256. Coupled with the next few cipher suites in the list, that all support Forward Secrecy, it means that the vast majority of my users benefit from a more secure connection. It's also good to see that the top 3 suites that are chosen use Elliptic Curve crypto, which is faster than the non-EC DHE suites that also provide forward secrecy, but have a slightly larger overhead. The prioritisation of my cipher suites plays a big part in that.
Browser Support
Browser support is commonly a sticking point for new features, but with HTTP/2, things are looking good already.
Supports HTTP/2 over TLS only (https)
Firefox v40+
Chrome v43+
Opera 32+
Chrome (Android) 46+
IE v11+ (Only on Win10)
Edge v12+
Safari v9+ (OS X 10.11+)
Safari iOS v9.1+
Supports HTTP/2 over insecure connections (http)
...
The only place you can't get HTTP/2 support right now is in Opera Mini and the native Android Browser. You can keep up to date on the latest HTTP/2 support on caniuse.com but right now, we're looking at about 70% of users that can use the new protocol.
Conclusion
It's really simple to setup the logs to gather this information and the commands to parse it down are pretty much a breeze too. My longer term hope is to setup something like the TLS Cipher Graphs over at Wikipedia and to be able to graph the output of logs like this. Take a look around and see what awesome things they have going on there. This could also be applied to graph the adoption of HTTP/2 for example.